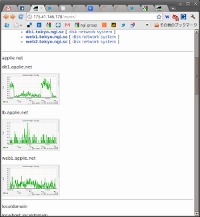
muninのトップページで各サーバのグラフを表示する
2011/03/17
muninのカスタマイズの話です。
Munin is a networked resource monitoring tool that can help analyze resource trends and “what just happened to kill our performance?” problems. It is designed to be very plug and play. A default installation provides a lot of graphs with almost no work. http://munin-monitoring.org/
muninのトップページ(overview)は、各サーバのレポートページへのリンク一覧が表示されてる。 でも、各サーバの状態は一覧できない。
トップページに、ロードバランサのグラフを表示するようにするには、トップページ生成のテンプレートファイルに以下を追加すればいいようです。Ubuntuにaptでmuninをインストールした場合、テンプレートファイルは、/etc/munin/templates/munin-overview.tmpl になります。
- /etc/munin/templates/munin-overview.tmpl
 <TMPL_LOOP NAME="GROUPS">
   <hr/>
   <div class="dmain">
     <p><TMPL_VAR ESCAPE="HTML" NAME="NAME"></p>
     <script>_d = '<TMPL_VAR ESCAPE="HTML" NAME="NAME">';</script>
   <TMPL_LOOP NAME="GROUPS">
     <div class="server">
       <p><TMPL_VAR ESCAPE="HTML" NAME="NAME"></p>
       <script>
         document.write('<a href="/munin/' + _d + '/<TMPL_VAR ESCAPE="HTML" NAME="NAME">/">');
         document.write('<img width="200" src="/munin/' + _d + '/<TMPL_VAR ESCAPE="HTML" NAME="NAME">/load-day.png"/>');
         document.write('</a>');
       </script>
     </div>
   </TMPL_LOOP>
   </div>
</TMPL_LOOP> |
外側のTMPL_LOOPの変数にアクセスすることができなくて、javascriptを使ってるあたりが、恥かしい。
